Storyline 360 Vertical Bar Chart Results from Likert Scale Survey Questions Format
May 29, 2017
By
Kevin Carter
Is their a way to have the results from the Likert Scale Survey Questions Format display as a Bar Chart?
Below is a sample of the Likert Scale Survey within the eLearning
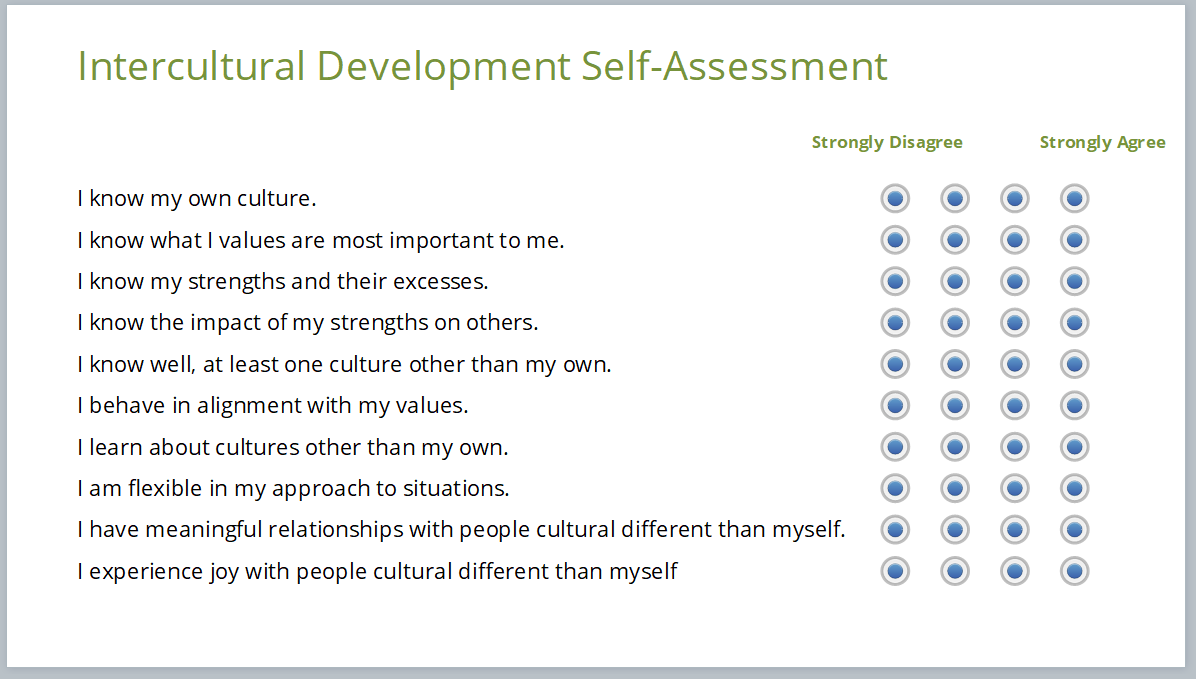
Is there a way to have the results of the survey be displayed within the training as a vertical bar chart with the horizontal axis being the categories Strongly Disagree, Somewhat Disagree, Somewhat Agree and Strongly Agree and the vertical axis being the number of questions falling within the category?
Are their other ways you might display the results of such a survey to the learning?
Thank you!
5 Replies
Hi Kevin,
Have you considered building the Likert scale in a Google Form and inserting it as a web object into Storyline? You could also insert the survey results bar graph as a web object--take a peek at this thread for more on that idea!
Hi Alyssa ... the Google Form is an excellent idea! Thank you! I think Peter in the other discussion also had the perfect idea. I think at the end of the day, I need to do three things:
1. Learner completed Likert Scale survey
2. Learning receives results of survey in some manner, either a point total, or bar chart. Or maybe, I don't need to provide either
3. Analysis and Suggestions based on how they scored.
It sounds like you've got some options, Kevin! Be sure to let us know how it turns out. 🙂
Hi .. So, I decided to do the survey / assessment in Typeform. The embedding works great!
Awesome! Thanks for coming back around to give us an update. :)
This discussion is closed. You can start a new discussion or contact Articulate Support.