I'm working on a survey kind of project where there will be a lot of questions that sorts your personality into five types. For example based on what answers the user gives he has 60% personality type 1 35%, type 2 and 5% type 3.
I want to visualize those result into a pie chart. I found some JavaScript based things but I can't seem to influence the results with some variables.
Do you have some links to the JS you found or samples of the code? Do you have a StoryLine file you can share that has your use-case? It would be helpful if we could start with what you already have and trouble shoot from there.
For example based on what answers the user gives he has 60% personality type 1 35%, type 2 and 5% type 3.
Another way you might approach this is with image states.
Build some pie charts with enough different image states to cover all the different percentages you believe you may want to visualize, then show those states depending on the user's responses.
Not nearly as flexible and dynamic as a javascript solution, but do-able with SL functionality...
I've got the storyline file and the javascript file attached. This .js file works perfecly. The only problem I am facing right now is that it won't retrieve the variables form the storyline file. I can't seem to find out what is missing..
I am looking to achieve the same thing as Nurdianna - however I think I am starting with a lot less expertise. Can somebody explain to me in laymen's terms, how I can create a survey (mine is about time management and how an individual's day is broken down in to 5 categories) and display results in a pie chart? I have 50 questions.
Create a custom question slide. Do not use Graded questions or Survey questions. These will limited your options in connecting your answers to the wanted variables.
Set your question in the slide and insert Radiobuttons. (in this case you'll need 5). Add a trigger to the radiobutton:
Adjust variable Add 1 to var1 When the user clicks Submit button If Radiobutton1 is equal to Selected
And so on.
You could also do this with sliders. Then your trigger will look like this:
Adjust variable Add 1 to var1 When the user clicks Submit button If Slider1 is equal to 1
If you got all the question slides set and the answers linked to the right category, your ready to build a javascript code.
HTML First you build a HTML file. Open a texteditor program like Notepad++ or Atom. This will call your javascript code. Type the following code in your html file:
Save it as index.html and open a new texteditor window. Now we make the piechart. Write down the following code:
// the JS code will first get a reference to the canvas and then set its width and height. To draw on the canvas, we only need a reference to its 2D context which contains all the drawing methods. //
/*global quotes:true, global $*/

window.onload = function() {
var player = GetPlayer();
var myCanvas = document.getElementById("myCanvas");
myCanvas.width = 300;
myCanvas.height = 300;
var ctx = myCanvas.getContext("2d");
// Define what the function. //
function drawLine(ctx, startX, startY, endX, endY) {
ctx.beginPath();
ctx.moveTo(startX, startY);
ctx.lineTo(endX, endY);
}
// This function draws an arc between the lines. //
function drawArc(ctx, centerX, centerY, radius, startAngle, endAngle) {
ctx.beginPath();
ctx.arc(centerX, centerY, radius, startAngle, endAngle);
ctx.stroke();
}
// This function draws a coloured shape between the lines. //
function drawPieSlice(ctx, centerX, centerY, radius, startAngle, endAngle, color) {
ctx.fillStyle = color;
ctx.beginPath();
ctx.moveTo(centerX, centerY);
ctx.arc(centerX, centerY, radius, startAngle, endAngle);
ctx.closePath();
ctx.fill();
/* drawLine(_ctx,100,100,200,200);
drawArc(_ctx, 150,150,150, 0, Math.PI/3);
drawPieSlice(_ctx, 150,150,150, Math.PI/2, Math.PI/2 + Math.PI/4, '#ff0000'); */
}
// This gives the pie slices a name. //
function displayChart(){

var var1 = player.GetVar("var1");
var var2 = player.GetVar("var2");
var var3 = player.GetVar("var3");
var var4 = player.GetVar("var4");
var var5 = player.GetVar("var5");
var myPersoonlijkheid = {
"Categorie1": var1,
"Categorie2": var2,
"Categorie3": var3,
"Categorie4": var4,
"Categorie5": var5
};
var Piechart = function(options) {
this.options = options;
this.canvas = options.canvas;
this.ctx = this.canvas.getContext("2d");
this.colors = options.colors;
this.draw = function() {
var total_value = 0;
var color_index = 0;
for (var categ in this.options.data) {
var val = this.options.data[categ];
total_value += val;
}
var start_angle = 0;
for (categ in this.options.data) {
val = this.options.data[categ];
var slice_angle = 2 * Math.PI * val / total_value;
drawPieSlice(this.ctx, this.canvas.width / 2, this.canvas.height / 2, Math.min(this.canvas.width / 2, this.canvas.height / 2), start_angle, start_angle + slice_angle, this.colors[color_index % this.colors.length]);
start_angle += slice_angle;
color_index++;
}
}
}
var myPiechart = new Piechart({
canvas: myCanvas,
data: myPersoonlijkheid,
//Here you can give the slices their colours//
colors: ["#f2f2f2", "#b3dcff", "#1b96ff", "#004682", "#002341"]

});
myPiechart.draw();
};

}
Note: make sure your variable name in the code is equal to the one you have in Storyline.
Save the file as pie-chart.js
Make sure the index.html and pie-chart.js are located in a new folder.
Now we go back to our storyline project.
Insert a new slide as a result slide and import a webobject. Select the file index.html as webobject and save your project. Publish it online and there you go! Your piechart is at the result slide!
I hope I helped you with it, if you got any questions about this tutorial, feel free to contact me; nurdianna@innowijs.nl
Make your project in Storyline and connect the answers of your category to a number variable. The amount of varables is equal to the amount of categories you have.
If you got all the question slides set and the answers linked to the right category, your ready to build a javascript code.
Hi Nurdianna
Thank you so much for your help with this. I really do appreciate it. You now have legendary status in my office!
I follow most of what you have said there, but please could you clarify how I go about achieving the above?
I have a survey question with the possible answers 1-5, please could you talk me through this stage?
connect the answers of your category to a number variable. The amount of variables is equal to the amount of categories you have.
I am really sorry to ask more of you, you have already been so helpful - but once I understand that bit, I think I'm good to go.
Nurdianna, it appears the JS you posted is missing a closing bracket "}" but I'm not sure exactly where in the code. Can you double check your file and repost?
So you got all your questions set, right? and you got your variables that goes parallel with the JS.
You need to connect the answer to those variables. So for each answer you need to create a trigger like this:
Adjust variable Add 1 to var1 When the user clicks Submit button If Radiobutton1 is equal to Selected
Though this is only possible when you're building a custom slide, so no graded question or survey question slide. Because then you won't be able to connect each answer to each varable.
I'm really sorry that I brought this up just now. But then it would work perfectly.
Attached is a screenshot with how the trigger should look like.
Thank you again for your help with this. It really is appreciated. For some reason, I'm not able to apply that trigger to my possible answers. I have attached one of my question slides. Are you able to take a look, and tell me what I'm doing wrong?
Thank you again for your help with this. It really is appreciated. For some reason, I'm not able to apply that trigger to my possible answers. I have attached one of my question slides. Are you able to take a look, and tell me what I'm doing wrong?
Hi Jon,
I forgot (again) to mention it has to be a number-variable, I'm sorry!
I made you a screenrecording with the actions I did to give the radiobutton this trigger.
Again, thank you so much for your time and help with this. I have attached a test questionnaire following the directions that you gave me - I just get a blank screen at the end. Are you able to tell me where I am going wrong?
I do believe something is missing as well. I set up a test file with 5 variables (var1, var2, etc) to correspond to those referenced in the code. The index.html page and the pie-chart.js page are in a new folder. The new folder is referenced for the web-object path. Yet, I also see nothing but a blank screen. It appears there must be some additional step or steps required.
Nurdianna, can you see what is missing? Maybe if you posted your files directly we could help troubleshoot.
Thanks for taking an interest in this and for trying to help. I can't actually open your file. It says it was built in an earlier version of Storyline.
Hmm.. Weird, I realy did the same steps and it showed me a pie-chart. But maybe I did missed something in my explanation. I've attached the story file so you can look it through. Maybe this will help.
@Owen, you do need a slide to set the variable to a certain value. Otherwize these variables wil be 0.
Very strange. When I use your JS and index file, it works. When I use my files which were copied from what you posted, it doesn't. I noticed a difference in the HTML file in that yours omits the typical opening <html> and <head> tags. I removed those in my file but it did not appear to make a difference. I will need to take some time to compare the JS files as well but I think that must be where there is some additional difference.
However, it works great with your file. Very nice work!
I think it is the call to the StoryLine player. In the JS code posted above, the call to the player occurs right before getting the values. In the file that works, the call to the SL player occurs 1st in the code and points to the parent window.
35 Replies
Do you have some links to the JS you found or samples of the code?
Do you have a StoryLine file you can share that has your use-case? It would be helpful if we could start with what you already have and trouble shoot from there.
Another way you might approach this is with image states.
Build some pie charts with enough different image states to cover all the different percentages you believe you may want to visualize, then show those states depending on the user's responses.
Not nearly as flexible and dynamic as a javascript solution, but do-able with SL functionality...
Hi Owen,
I've got the storyline file and the javascript file attached. This .js file works perfecly. The only problem I am facing right now is that it won't retrieve the variables form the storyline file. I can't seem to find out what is missing..
This post was removed by the author
Ooh I managed to make it work!
I only added the line " var player = window.parent.GetPlayer(); " at the top of the javascript. Now it retrieves variables from Storyline :D
Glad you got it sorted out! Can we see the results? Can you share your .story file?
Hi
I am looking to achieve the same thing as Nurdianna - however I think I am starting with a lot less expertise. Can somebody explain to me in laymen's terms, how I can create a survey (mine is about time management and how an individual's day is broken down in to 5 categories) and display results in a pie chart? I have 50 questions.
Your help would be gratefully received!
thanks
Jon
Use Javascript in Storyline to create a piechart.
Storyline
Create a custom question slide. Do not use Graded questions or Survey questions. These will limited your options in connecting your answers to the wanted variables.
Set your question in the slide and insert Radiobuttons. (in this case you'll need 5). Add a trigger to the radiobutton:
Adjust variable
Add 1 to var1
When the user clicks Submit button
If Radiobutton1 is equal to Selected
And so on.
You could also do this with sliders. Then your trigger will look like this:
Adjust variable
Add 1 to var1
When the user clicks Submit button
If Slider1 is equal to 1
If you got all the question slides set and the answers linked to the right category, your ready to build a javascript code.
HTML
First you build a HTML file. Open a texteditor program like Notepad++ or Atom. This will call your javascript code. Type the following code in your html file:
Save it as
index.htmland open a new texteditor window. Now we make the piechart. Write down the following code:Note: make sure your variable name in the code is equal to the one you have in Storyline.
Save the file as
pie-chart.jsMake sure the
index.htmlandpie-chart.jsare located in a new folder.Now we go back to our storyline project.
Insert a new slide as a result slide and import a webobject. Select the file index.html as webobject and save your project. Publish it online and there you go! Your piechart is at the result slide!
I hope I helped you with it, if you got any questions about this tutorial, feel free to contact me; nurdianna@innowijs.nl
Hi Nurdianna
Thank you so much for your help with this. I really do appreciate it. You now have legendary status in my office!
I follow most of what you have said there, but please could you clarify how I go about achieving the above?
I have a survey question with the possible answers 1-5, please could you talk me through this stage?
connect the answers of your category to a number variable. The amount of variables is equal to the amount of categories you have.
I am really sorry to ask more of you, you have already been so helpful - but once I understand that bit, I think I'm good to go.
Jon
Nurdianna, it appears the JS you posted is missing a closing bracket "}" but I'm not sure exactly where in the code. Can you double check your file and repost?
Oh sorry! I forgot to tell you that part. :'D
So you got all your questions set, right? and you got your variables that goes parallel with the JS.
You need to connect the answer to those variables. So for each answer you need to create a trigger like this:
Adjust variable
Add 1 to var1
When the user clicks Submit button
If Radiobutton1 is equal to Selected
Though this is only possible when you're building a custom slide, so no graded question or survey question slide. Because then you won't be able to connect each answer to each varable.
I'm really sorry that I brought this up just now. But then it would work perfectly.
Attached is a screenshot with how the trigger should look like.
Hi Owen,
Thank you for noticing, it was indeed missing a closing bracket. I've updated the post.
Hi Nurdianna
Thank you again for your help with this. It really is appreciated. For some reason, I'm not able to apply that trigger to my possible answers. I have attached one of my question slides. Are you able to take a look, and tell me what I'm doing wrong?
Hi Jon,
I forgot (again) to mention it has to be a number-variable, I'm sorry!
I made you a screenrecording with the actions I did to give the radiobutton this trigger.
I hope this will help you!
Hi Nurdianna
Again, thank you so much for your time and help with this. I have attached a test questionnaire following the directions that you gave me - I just get a blank screen at the end. Are you able to tell me where I am going wrong?
Thanks
Jon
I do believe something is missing as well. I set up a test file with 5 variables (var1, var2, etc) to correspond to those referenced in the code. The index.html page and the pie-chart.js page are in a new folder. The new folder is referenced for the web-object path. Yet, I also see nothing but a blank screen.
It appears there must be some additional step or steps required.
Nurdianna, can you see what is missing? Maybe if you posted your files directly we could help troubleshoot.
Hi Owen
Thanks for taking an interest in this and for trying to help. I can't actually open your file. It says it was built in an earlier version of Storyline.
Jon
Hi Jon,
Hmm.. Weird, I realy did the same steps and it showed me a pie-chart. But maybe I did missed something in my explanation. I've attached the story file so you can look it through. Maybe this will help.
@Owen, you do need a slide to set the variable to a certain value. Otherwize these variables wil be 0.
That shouldn't be required for my file as I had given each of the variables an assigned "default value".
I'll look at your .story file but could you also post your JS file and your index.html file?
Hi Owen,
Oh yeah, you're right!
Attached the index and js files.
How are you assigning your web objects path? It appears that this might be where the difference lies.
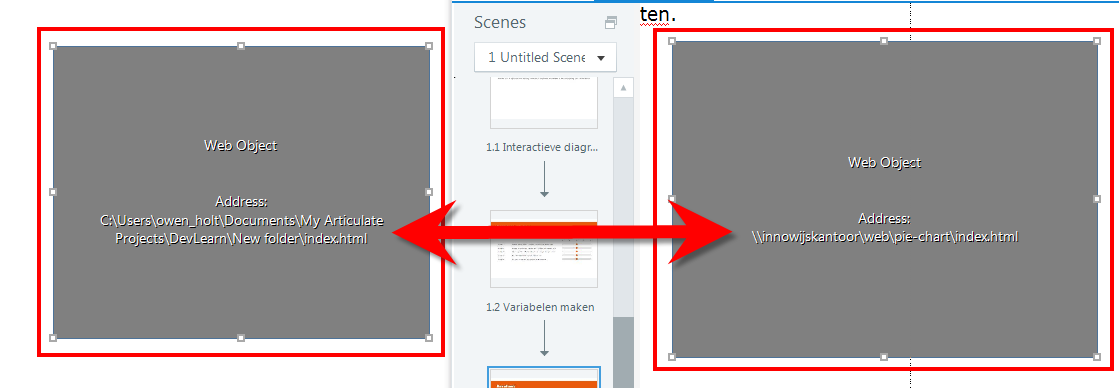
I've put the web objects in the same folder as the story file.
So what do I need to do to my project to make it work? Or have we not worked that out as yet?
Thanks
Very strange. When I use your JS and index file, it works. When I use my files which were copied from what you posted, it doesn't. I noticed a difference in the HTML file in that yours omits the typical opening <html> and <head> tags. I removed those in my file but it did not appear to make a difference. I will need to take some time to compare the JS files as well but I think that must be where there is some additional difference.
However, it works great with your file. Very nice work!
I think it is the call to the StoryLine player. In the JS code posted above, the call to the player occurs right before getting the values. In the file that works, the call to the SL player occurs 1st in the code and points to the parent window.
var player = window.parent.GetPlayer();