Tips for Creating Custom Diagrams in PowerPoint
A while back, I did a post about using the multimedia principle. In a nutshell, it’s where you can enhance learning by selectively adding graphics that illustrate the key concepts and ideas in your e-learning course. This research-based methodology makes a lot of sense, and yet a lot of rapid e-learning authors are reluctant to create custom charts and diagrams in their work. Why? A majority say it comes down to two things: either they think they need specialized software to build them, or they’re worried they’ll take too long to make.
The truth is, anyone can build great-looking custom charts and diagrams right in PowerPoint. You can create all kinds of shapes and lines, and arrange them exactly the way you want. You don’t need special software or additional training … just PowerPoint. It’s my favorite tool because it’s so fast and easy—in fact, it’s usually less work to create my own graphics than to find existing ones that work perfectly.
To get you started, here’s a tutorial about building better charts and diagrams in PowerPoint and saving time in the process.
Use Connectors Instead of Regular Lines
Connectors are lines that have connection points at the end and stay attached to the shapes where you affix them. You can use almost any line as a connector. The trick is to attach each end of the line to an anchor point on the two shapes you are connecting.

Lock Drawing Mode
Many diagrams use the same shape many times. When adding multiple versions of the same shape or line to a diagram, locking the drawing mode is a big time-saver. Normally, every time you add a shape to your slide, PowerPoint makes you return to the Shape Gallery and select which shape you want to add next. If you want to repeat the same shape several times you can skip that step by right-clicking the shape and selecting Lock Drawing Mode. Then you can add this shape as many times as you want without having to reselect it. When you’re done, just press the ESC key.

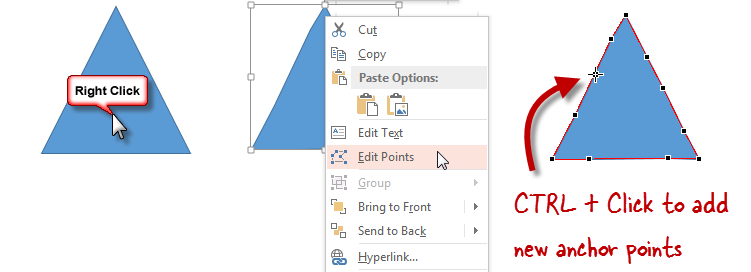
Add Custom Anchor Points
By default, shapes already have a limited number of anchor points where connectors can attach. However, you can add more custom anchor points anywhere you want. Just right-click the shape and select Edit Points. Then CTRL + Click anywhere on the shape border where you want to add an anchor point.
Now that you have some good tips for working with shapes, you can quickly and easily create the perfect diagrams and charts for your e-learning projects. Or maybe you already have—do you have experience creating custom diagrams? If so, leave a comment and share your tips and insights with the community. We love your feedback!
Post by Mike Taylor
Don’t forget to post your questions and comments in the forums! Remember, we’re here to help. For more e-learning tips, examples, and downloads, follow us on Twitter.
8 Comments