Adding a Chart Block in Rise 360

Graphs and charts are a great way to present data; they can be used to convey information and to make sense of numbers and metrics. And now adding them to your e-learning courses has never been easier thanks to the new chart block available in Rise 360.

To add a chart block just open up the All Blocks library and click the new Charts category. You’ll have three chart block types to choose from:
- Bar chart
- Line chart
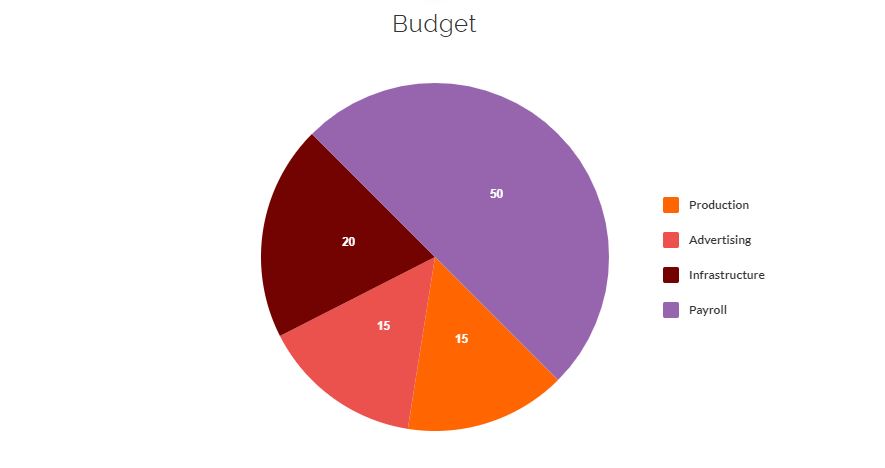
- Pie chart
Click a chart type to insert it as a new block in your lesson. Customizing your chart block is super intuitive. Just click the Edit button, type in the items and values, and then add your labels and chart title.

You can customize your charts further by changing the colors. For pie charts, you can even select a different color for each slice of the pie, creating a beautiful, multi-colored visual.
Charts are a great way to help learners visualize information, and because it’s Rise 360, they look beautiful on every device and orientation. Give the chart block a try in your next lesson and let us know how it goes in the comments below.
Want to try something you learned here, but don’t have Articulate 360? Start a free 30-day trial, and come back to E-Learning Heroes regularly for more helpful advice on everything related to e-learning. If you have any questions, please share them in the comments.
21 Comments