Progress meter – How to create one in Articulate Storyline
Feb 05, 2016
A couple of months ago I uploaded the material design template. One community member asked me how the progress bar worked. In this post I will explain how I did it.
Note: this tutorial is based on the material design template. Use this template to see the progress bar in action.
1. The progress meter
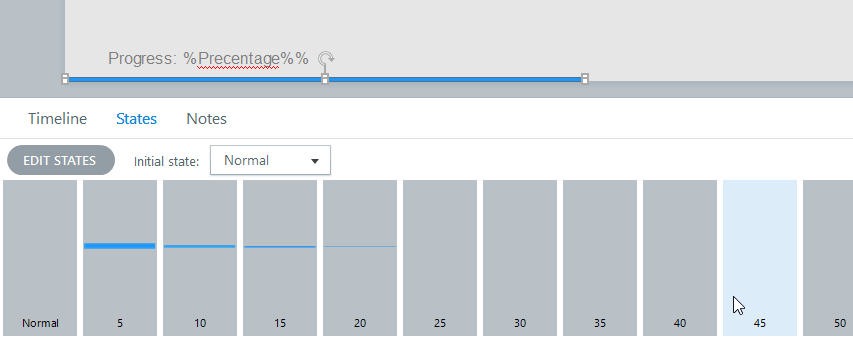
The first thing you need to do is to build a progress bar. This can be as simple as a bar which gets larger as you progress in the course. My progress bar can be found in the slide master, on the menu slide. This is a rectangle shape with 20 states (the normal state is 0%, 1st state is 5%, 2nd state is 10%, and so on). So when a learner is on 60 % of the course, the progress bar will show state 60.
See http://www.hongkiat.com/blog/beautiful-progress-bars/ for inspiration for progress bars (thanks to Nicole Legault).
2. Counting the visited slides
The second part is the tricky one. You need to count the visited slides. There is a variable (SlideVisitCounter) which counts how many slides are visited. Each time a slide is visited for the first time, “1” will be added to this variable. However, when you visit a slide for the second time, it mustn’t add “1” to this variable.
You could use a T/F variable for each slide, which changes if a slide is visited. However, when you have a large project, this isn’t sustainable. So I did the following:
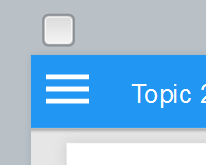
Each slide has a checkbox. When this checkbox is unchecked, it means it isn’t visited before and "1" must be added to the SlideVisitCounter variable. When the checkbox is checked, the slide is already visited.
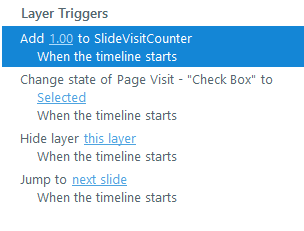
Each slide has also a next button with two triggers. When the user clicks the next button, the triggers will check if the checkbox is checked. If this is the case, the learner will go to the next slide. When the checkbox is unchecked however, the user will go to a layer, called counter. This layer consists of 4 triggers and nothing more (so no objects on the layer timeline). The triggers will first add "1" to the variable SlideVisitCounter. Then the checkbox is checked. After that the layer is hided and finally the learner will go to the next slide. So "1" is added to the variable and when the learner revisits the slide, the checkbox is checked.
Remark: When you use a quiz slide, you need to apply the two triggers of the next button on the correct slide.
3. Calculating the progress percentage
So, now we have a variable with the number of slides which are visited. In this step where going to calculate the progress percentage. We will use this simple formula: (Visited slides/Total Slides)*100. So we need a variable with the total number of slides. This is the variable TotalSlides. The default value of this variable is the total number of slides. In my case there are 26 slides, so that is the default of this variable.
The progress percentage is calculated in the slide master on the menu slide. I used two extra variable, which are called Decimals and Percentage. See the image for the corresponding triggers:
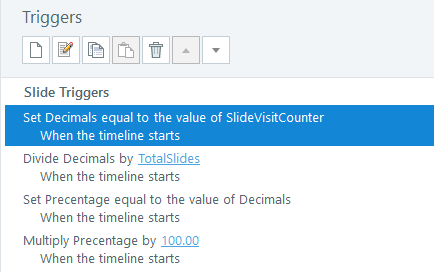
So after this step we have a variable Percentage which contains the progress percentage.
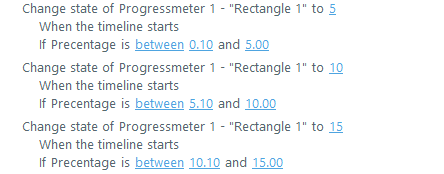
4. Changing the state of the progress bar.
The last step of this tutorial is to change the state of the progress bar based on the Percentage variable. This is also been done on the slide master, the menu slide. The progress bar is changed with the trigger, change state. When the variable Percentage is between 5.10 and 10.00, the state of the progress bar must be 10. See the image for the triggers:
So this was it. I hope it is useful. If you have any questions, don’t hesitate to ask.
Regards.
6 Replies
This worked great! Thank you so much for your instructions.
Thanks for providing such a detailed explanation -- as well as the template itself. Very helpful!
Thank you for your comments
Yo creo que se puede hacer de una manera más fácil.
What if I want to display the percentage completion by determining if user finished the video on the last slide before jumping to the next lesson?
I know this is an old thread and not sure if you're still around Weibe. This is pretty amazing. I have a question. to use this every slide that you create has to use this master layout, correct?