Customising the results slide
Apr 03, 2014
I'm putting together a quiz for my tech-shy (or so they think) internal team. The language is very informal, the questions and responses a bit unusual. I'm trying to funk it up a bit. I have had to be a bit out of the box with my thinking to make it work with the quiz templates available (I have some suggestions on this point - not sure how to make them), but the results slide is letting me down. I love the look of the thumbnail in the Insert Slide dialog box, but I am at a loss as to how to make mine look anything like it. I tried using a handwritten looking font, but the top and bottom of the number got cut off.
Also, I don't want a pass/fail thing. I want to say "You are 80% geeky, you clearly blah blah" or "You are 20% geeky, here are some things blah blah blah"
Am I baying at the moon?
7 Replies
Hi Karyn
You have to add the Blank Result slide and edit it to your requirements.
here i have attached an example how you can do this. "Result score points" would give you the marks obtained
Hope this helps
Thanks Rehan. I managed to achieve something fairly similar to that, but nothing like the thumbnail. And the top of my percentage number was cut off, no matter what I tried to do.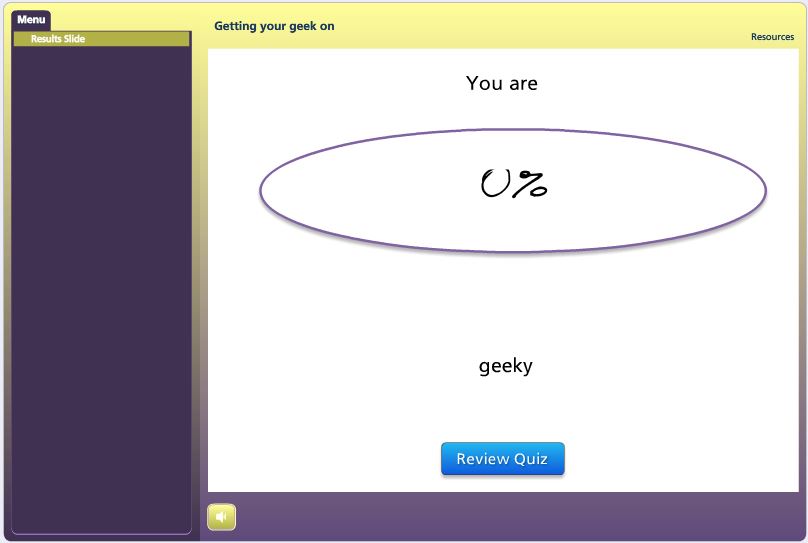
I also don't see a way to give feedback based on a sliding scale. There seems to be the option to have a pass or a fail. But this in't that kind of assessment.
How does this looks like???
"Non-standard" feedback slides - YEY!
Hmm....
Was thinking along these lines - but cannot get it to work at the moment.
Hi Karyn,
You could determine what is shown to the user by creating different layers that would be shown based on the score received - no need to limit to pass fail. You'll want to look into using the conditions associated with the trigger panel, so say that it would look something like this:
Show layer -Kinda Geeky if the Results1.scorepoint is greater than 50 and less than 65
Show layer - Totally cool kid if the Results1.scorepoints is less than or equal to 50
Show layer - super geeky if the Results1.scorepoint is greater than 65 and less than 80
Show layer - The Geekiest if the Results1.scorepoint is greater than or equal to 80
So it's up to you to determine those cut points and what is shown on each layer. You may even want to use something like this cool progress meter on the results slide.
Ah...looks like I used the wrong variable then.....
Hi All,
Karyn, you peaked my whimsical side with this one. Coupla' things: You CAN use the regular Results Slide and customize any way you'd like. That's what I did with the attached.
Question Slide and Results Slide Layouts
Background for Question Slides: 2 rectangles on the Slide Master: question layout.
Background for Results Slide: rectangle on the Slide Master: blank layout
Radio Fill on Question Slides changed to brown
Question box narrowed significantly.
See all notes slides for images source (all are Pixaby...LOVE Pixabay)
Results Slide
Images were inserted onto the Success layer (100% and 80%) and Failure Layers (0, 20, 40, and 60%)
Results Slide Success Layer
Results Slide Failure Layer
I think that covers it...let me know if I missed anything and please shout out with any questions.
Oh, and tx for the inspiration!
This discussion is closed. You can start a new discussion or contact Articulate Support.